How It Works
Richfolio is a single-pipeline system — no API server, no database, no dashboard. It runs once, produces a report, and exits.
Data Pipeline
CONFIG_JSON variable + GitHub Secrets
→ fetchPrices (Yahoo Finance: prices, P/E, 52w range, beta, dividends, ETF holdings, fundamentals, earnings calendar)
→ fetchTechnicals (Yahoo Finance chart: SMA50, SMA200, RSI, MACD, Bollinger Bands, ATR, Stochastic, OBV, momentum)
→ fetchNews (NewsAPI: top headlines per ticker + Gemini sentiment scoring)
→ analyze (allocation gaps, P/E signals, overlap discounts, portfolio metrics)
→ aiAnalyze (Gemini two-stage Think/Plan: Stage 1 Observe → Stage 2 Decide + reasoning history)
→ guards (post-AI validation: earnings guard, STRONG BUY criteria, bond cap, confidence/value sanity)
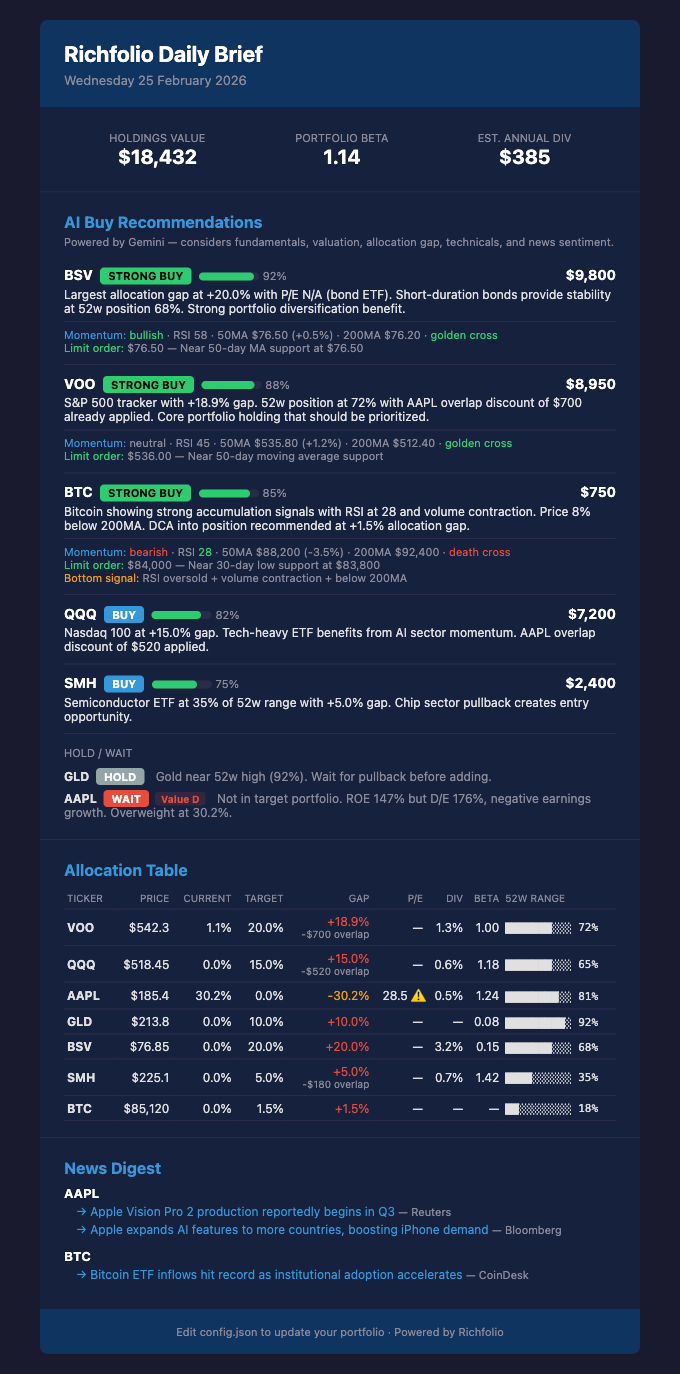
→ email + telegram (deliver daily brief with value ratings, bottom signals, technicals, earnings badges)
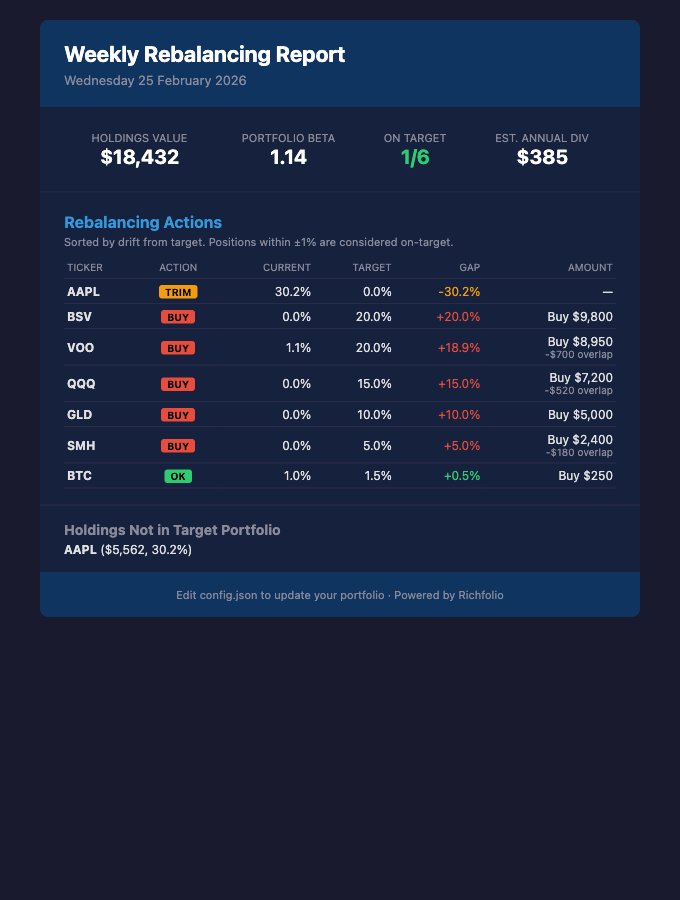
Weekly mode (--weekly) skips news, technicals, and AI, producing a focused rebalancing report.
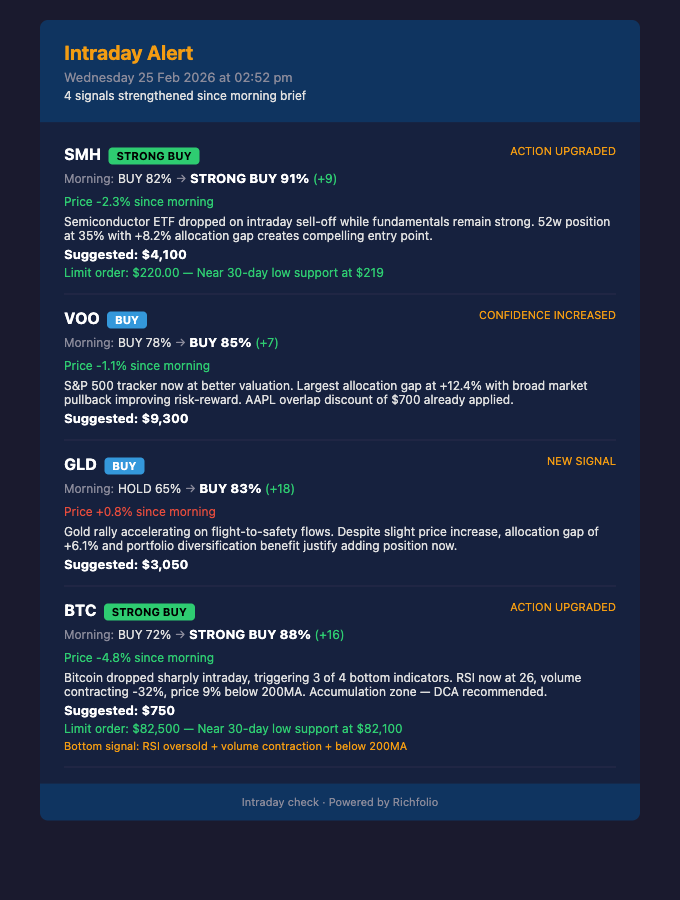
Intraday mode (--intraday) re-fetches prices and technicals, re-runs AI (skipping news), compares against the morning baseline, and alerts only when signals strengthen.
Architecture
src/
├── config.ts          # Typed loader for CONFIG_JSON variable + GitHub Secrets
├── index.ts           # Entry point — parses --weekly/--intraday flags, wires modules
├── fetchPrices.ts     # Yahoo Finance via yahoo-finance2 (instance-based v3 API) + fundamentals + earnings calendar
├── fetchTechnicals.ts # Yahoo Finance chart: SMA50, SMA200, RSI, MACD, Bollinger Bands, ATR, Stochastic, OBV
├── fetchNews.ts       # NewsAPI with ticker-to-company-name mapping + Gemini sentiment scoring
├── analyze.ts         # Core analysis: gaps, P/E signals, overlap, portfolio metrics
├── aiAnalysis.ts      # Two-stage Gemini Think/Plan prompt builder + JSON response parser + retry logic
├── guards.ts          # Post-AI validation pipeline: 6 sequential safety checks
├── detailedAnalysis.ts# Gemini 2.5 Flash: detailed buy thesis + risk analysis for STRONG BUY tickers
├── analysisUrl.ts     # Compress analysis data into URL hash for the GitHub Pages analysis page
├── state.ts           # Morning baseline save/load for intraday comparison + 7-day reasoning history
├── intradayCompare.ts # Compare current AI recs vs morning baseline
├── email.ts           # Daily HTML email template + Resend delivery
├── intradayEmail.ts   # Intraday alert email template + Resend delivery
├── weeklyEmail.ts     # Weekly rebalancing email template + Resend delivery
└── telegram.ts        # Telegram Bot API delivery (daily + intraday + weekly formatters)
Each module is independent — they communicate through typed interfaces (QuoteData, TechnicalData, AllocationItem, AllocationReport, AIBuyRecommendation, IntradayAlert, TickerObservation). QuoteData includes fundamental data (ROE, debt/equity, FCF, margins, growth) from Yahoo’s financialData module, plus earnings calendar data (next earnings date, days to earnings). TechnicalData includes MACD (crossover + histogram), Bollinger Bands (%B, bandwidth, squeeze), ATR (volatility), Stochastic (%K/%D), OBV trend (accumulation/distribution), and volume change (7d vs 30d) for bottom-fishing detection. TickerObservation is the intermediate output from the Think stage, containing structured signals, risk flags, and summaries.
Analysis Logic
Allocation Gaps
For each ticker in your target portfolio:
- Current value = shares held × current price
- Current % = current value / portfolio value × 100
- Gap % = target % − current %
- Suggested buy = gap % × portfolio value (only when underweight)
Portfolio value uses the higher of actual holdings value or configured totalPortfolioValue.
The system supports portfolios denominated in any of the following currencies: USD, GBP, EUR, AUD, CAD, JPY, CHF, HKD, SGD, NZD. Set defaultCurrency in your config to your preferred display currency. Tickers quoted in other currencies (e.g. UK LSE stocks in GBp) are auto-detected, unit-fixed (LSE pence ÷ 100), and FX-converted via Yahoo Finance for display.
Dynamic P/E Signals
Yahoo Finance provides quarterly EPS data via earningsHistory. Richfolio computes:
- Filter positive quarterly EPS values (need at least 2 quarters)
- Average quarterly EPS → annualize (× 4)
- Average P/E = current price / annualized EPS
- Compare trailing P/E against this average:
- Below average → potential value opportunity
- Above average → potentially overvalued
ETFs and crypto skip this signal (no earnings data).
ETF Overlap Detection
For each target ETF, Yahoo Finance returns its top ~10 holdings with weight percentages. Richfolio checks if you hold any of those stocks directly:
- For each ETF holding that matches a stock in
currentHoldings:- ETF exposure = holding weight × ETF’s suggested buy value
- Your exposure = shares held × stock price
- Overlap = min(ETF exposure, your exposure)
- Sum all overlaps for the ETF
- Reduce the ETF’s suggested buy value by the total overlap
Example: VOO contains ~7% AAPL. If you hold $8,000 in AAPL and VOO’s suggested buy is $10,000, the AAPL overlap is min(7% × $10,000, $8,000) = $700. VOO’s buy suggestion drops to $9,300.
52-Week Range Scoring
Each ticker’s price is positioned within its 52-week range:
- 0–20% → near 52-week low (buying opportunity signal)
- 20–80% → mid-range (neutral)
- 80–100% → near 52-week high (caution signal)
Technical Indicators
Richfolio fetches ~250 days of daily OHLCV data via yahooFinance.chart() and computes:
- SMA50 — simple moving average of the last 50 closing prices
- SMA200 — simple moving average of the last 200 closing prices (null if < 200 data points)
- RSI(14) — standard Relative Strength Index using 14-day average gain/loss
- MACD — EMA(12) − EMA(26), with signal line = EMA(9) of MACD line. Reports the histogram (MACD − signal, positive = bullish momentum) and detects bullish/bearish crossovers from the last 2 trading days. Requires 35+ data points. Best for confirming trend direction
- Bollinger Bands — SMA(20) ± 2 standard deviations. Reports %B (0 = at lower band, 1 = at upper band), bandwidth (volatility measure), and squeeze detection (bandwidth in bottom 20% of 120-day range, signaling an imminent breakout). Requires 20+ data points. Best for range-bound markets
- Momentum signal:
- Bullish — price > SMA50, SMA50 > SMA200, RSI > 40
- Bearish — price < SMA50, SMA50 < SMA200, RSI < 60
- Neutral — mixed signals
- ATR(14) — Average True Range with Wilder’s smoothing. Reports absolute value and % of price. ATR% > 3% = high volatility (widen limit orders), ATR% < 1% = low volatility (tighter limits). Requires 15+ data points
- Stochastic Oscillator — %K(14) with %D(3) SMA smoothing. %K < 20 = oversold confirmation (added to momentum signals for STRONG BUY criteria), %K > 80 = overbought. Requires 16+ data points
- OBV trend — On-Balance Volume with 10-day linear regression slope normalized by average volume. Reports direction: rising (accumulation), falling (distribution), or flat. Absolute OBV is meaningless across tickers. Requires 11+ data points
- Golden/Death cross — SMA50 crossing above (golden) or below (death) SMA200
- Recent lows — minimum price in last 7 and 30 trading days (support levels)
- Volume change — 7-day average volume vs prior 30-day average (used by the bottom-fishing model to detect selling exhaustion)
Tickers with fewer than 50 data points are gracefully skipped. All indicators are computed from existing chart data — zero extra API calls.
AI Scoring (Two-Stage Think/Plan)
Richfolio uses a two-stage AI framework inspired by OpenAlice’s cognitive architecture:
Stage 1 — Observe (Think): The Gemini prompt receives all data points per ticker — price, P/E ratios, 52-week position, allocation gap, dividend yield, beta, ETF overlap, technical indicators (MAs, RSI, MACD, Bollinger Bands, ATR, Stochastic, OBV, momentum, volume change), fundamental data (ROE, debt/equity, FCF, margins, growth, analyst targets), earnings calendar, macro environment, and recent news headlines with sentiment scores. The AI extracts structured observations: which price-level signals are present, which momentum signals are active, risk flags, summaries, and news sentiment. No action recommendations at this stage.
Stage 2 — Decide (Plan): A separate Gemini call receives the structured observations from Stage 1, the decision rules, gap amounts, macro context, and 7-day reasoning history. Because it works with pre-digested observations (not raw numbers), it applies the STRONG BUY criteria more consistently. The AI returns:
- Action: STRONG BUY, BUY, HOLD, or WAIT
- Confidence: 0–100%
- Reason: 1–2 sentence explanation
- Suggested amount: USD to invest
- Limit order price: suggested price below market based on nearest support (MAs, recent lows, round numbers)
- Limit price reason: 1 sentence explaining the support level
- Value rating: A/B/C/D for individual stocks (empty for ETFs and crypto)
- Bottom signal: oversold/accumulation zone description (empty if no indicators present)
Value Investing Framework (Stocks Only)
The AI rates each individual stock A–D based on five fundamental criteria: ROE > 15%, debt/equity < 50%, FCF/operating CF > 80%, positive earnings growth, and price below analyst target. The rating adjusts the AI’s confidence score (A boosts ~10 points, D reduces ~10 points). Fundamental data comes from Yahoo’s financialData module — added to the existing quoteSummary call with zero extra API overhead.
Bottom-Fishing Model (All Tickers)
The AI evaluates four bottom indicators for every ticker (stocks, ETFs, and crypto): RSI < 30, volume contraction > 20%, price below 200-day MA, and death cross. Crypto triggers a bottom signal at 2+ indicators; stocks and ETFs require 3+ (stricter threshold to avoid false signals from single dips). Volume change is computed from existing chart data — no additional API calls.
Technical indicators further refine the AI’s confidence — a bullish momentum signal with oversold RSI strengthens a buy case, while bearish signals or overbought RSI weaken it. The AI follows an explicit indicator conflict resolution hierarchy: MACD is trusted in trending markets, Bollinger Bands in range-bound markets. When both agree (e.g., bullish MACD crossover + bounce off lower Bollinger Band), confidence is boosted 5–10 points. A Bollinger Squeeze with a simultaneous MACD crossover is treated as the strongest entry signal (confidence boost 10–15 points). When they disagree (e.g., bullish MACD but %B near upper band), confidence is reduced to avoid overextended entries.
After the AI returns recommendations, the guard validation pipeline (guards.ts) runs 6 sequential checks: bond ETF cap, earnings proximity, STRONG BUY criteria enforcement, max 2 STRONG BUY, confidence sanity, and buy value sanity. Guards catch cases where the AI ignores prompt instructions and serve as a programmatic safety net.
If Gemini is unavailable, the system falls back to gap-based ranking (largest allocation gap first). Transient Gemini errors (503/429) are automatically retried up to 2 times with 5s/10s backoff before falling back.
Detailed Analysis Page (STRONG BUY Only)
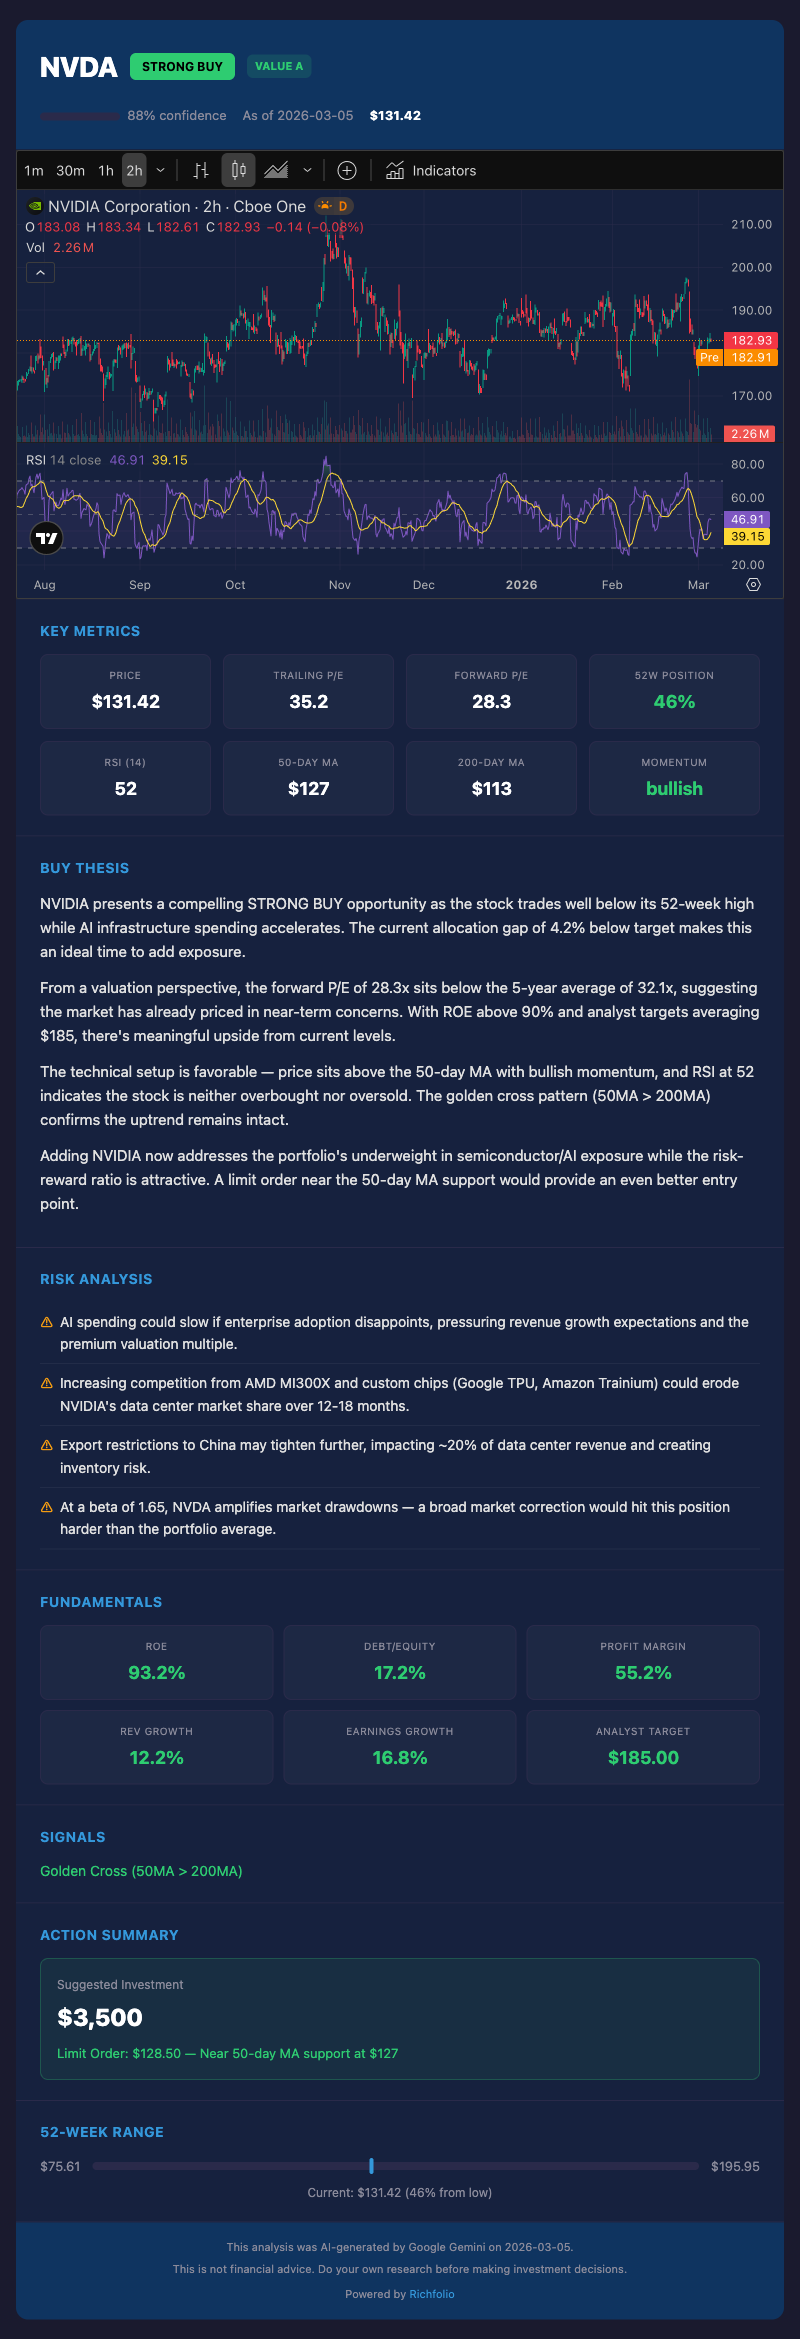
For each STRONG BUY ticker, a separate Gemini 2.5 Flash call generates an in-depth buy thesis (3–4 paragraphs) and 3–4 specific risk factors. This detailed analysis, along with all metrics and technical data, is compressed using zlib and encoded as a base64url URL hash fragment.
The email and Telegram messages include a “More Details” link pointing to a static analysis page hosted on GitHub Pages (docs/analysis/index.html). The page decodes the URL hash client-side using pako and renders:
- Interactive TradingView chart — 6-month candlestick with SMA50, SMA200, and RSI overlays
- Key metrics grid — price, P/E, 52-week position, RSI, moving averages, momentum
- Buy thesis — multi-paragraph detailed analysis from Gemini Flash
- Risk analysis — specific risk factors to watch
- Fundamentals — ROE, debt/equity, margins, growth, analyst target (stocks only)
- Signals — golden/death cross, bottom signals (crypto)
- Action summary — suggested investment amount, limit order price with reasoning
- 52-week range bar — visual position within the yearly range
No server-side logic is needed — all data is embedded in the URL. The page works offline once loaded. The URL is typically ~1,000–1,500 characters, well within email client limits.
Three Modes
| Daily | Intraday | Weekly | |
|---|---|---|---|
| Prices & fundamentals | Yes | Yes | Yes |
| Technical indicators | Yes | Yes | No |
| News headlines | Yes | No | No |
| AI recommendations | Yes | Yes | No |
| Limit order prices | Yes | Yes | No |
| Value ratings (stocks) | Yes | Yes | No |
| Bottom signals (crypto) | Yes | Yes | No |
| Allocation analysis | Yes | Yes | Yes |
| Baseline comparison | Saves baseline | Compares vs morning | No |
| Email template | Full brief | Alert (triggered only) | Rebalancing table |
| Telegram format | AI recs + news | Alert (triggered only) | BUY/TRIM actions |