Features
Richfolio packs 19+ capabilities into a single pipeline — all running on free-tier APIs.
Two-Stage AI Analysis (Think/Plan Framework)
Richfolio uses a two-stage cognitive framework inspired by OpenAlice’s Think/Plan architecture:
Stage 1: Observe (Think) — Gemini extracts structured observations per ticker: which price-level signals are present (P/E below average, near 52w low, below 200MA), which momentum signals are active (RSI < 35, bullish MACD, Bollinger %B < 0.15, Stochastic %K < 20), risk flags, 1-sentence valuation and technical summaries, news sentiment, and allocation context. No action recommendations at this stage — pure data parsing.
Stage 2: Decide (Plan) — A separate Gemini call receives the structured observations (not raw numbers) plus all decision rules, historical reasoning context, and applies the STRONG BUY criteria to produce final recommendations. Because the decision stage works with pre-digested observations, it applies the strict criteria more consistently.
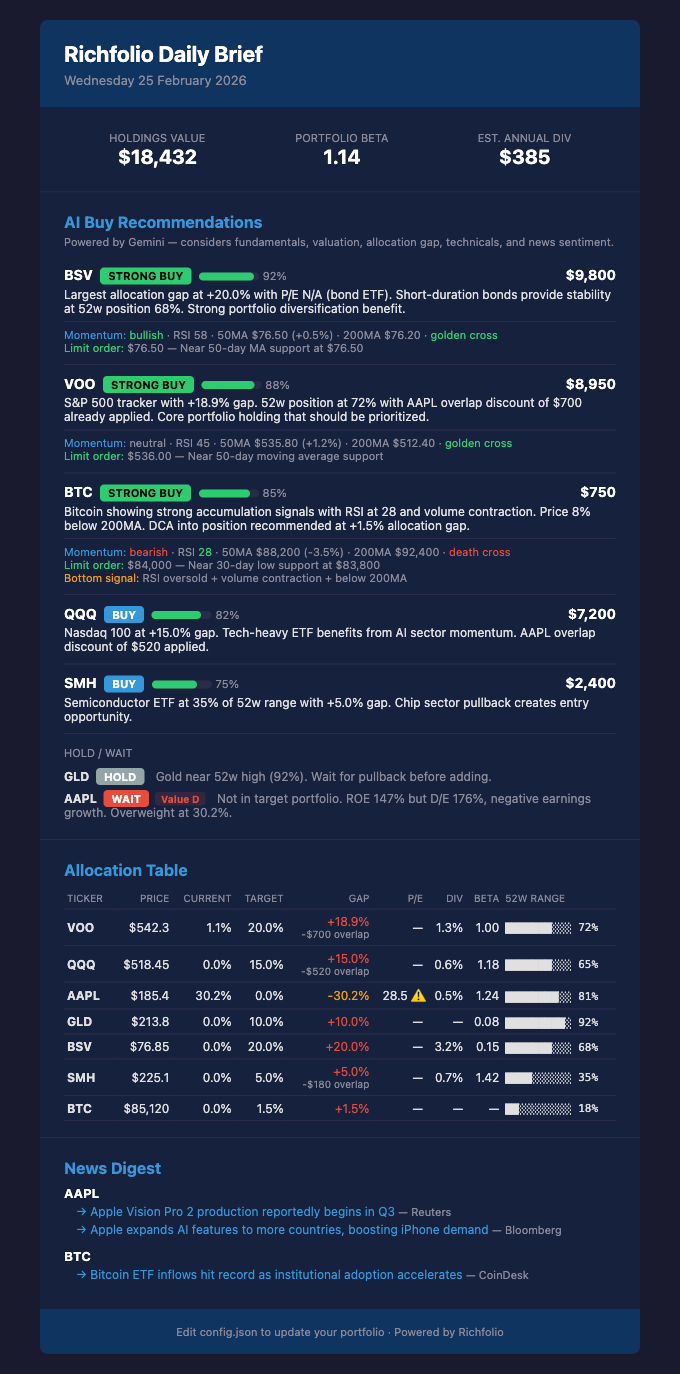
Each ticker gets an action: STRONG BUY, BUY, HOLD, or WAIT, along with a suggested dollar amount, limit order price, value rating (stocks), and bottom signal (oversold detection). If the Gemini API is unavailable or quota is exhausted, Richfolio falls back to gap-based recommendations automatically. Transient Gemini errors (503/429) are automatically retried up to 2 times with backoff.
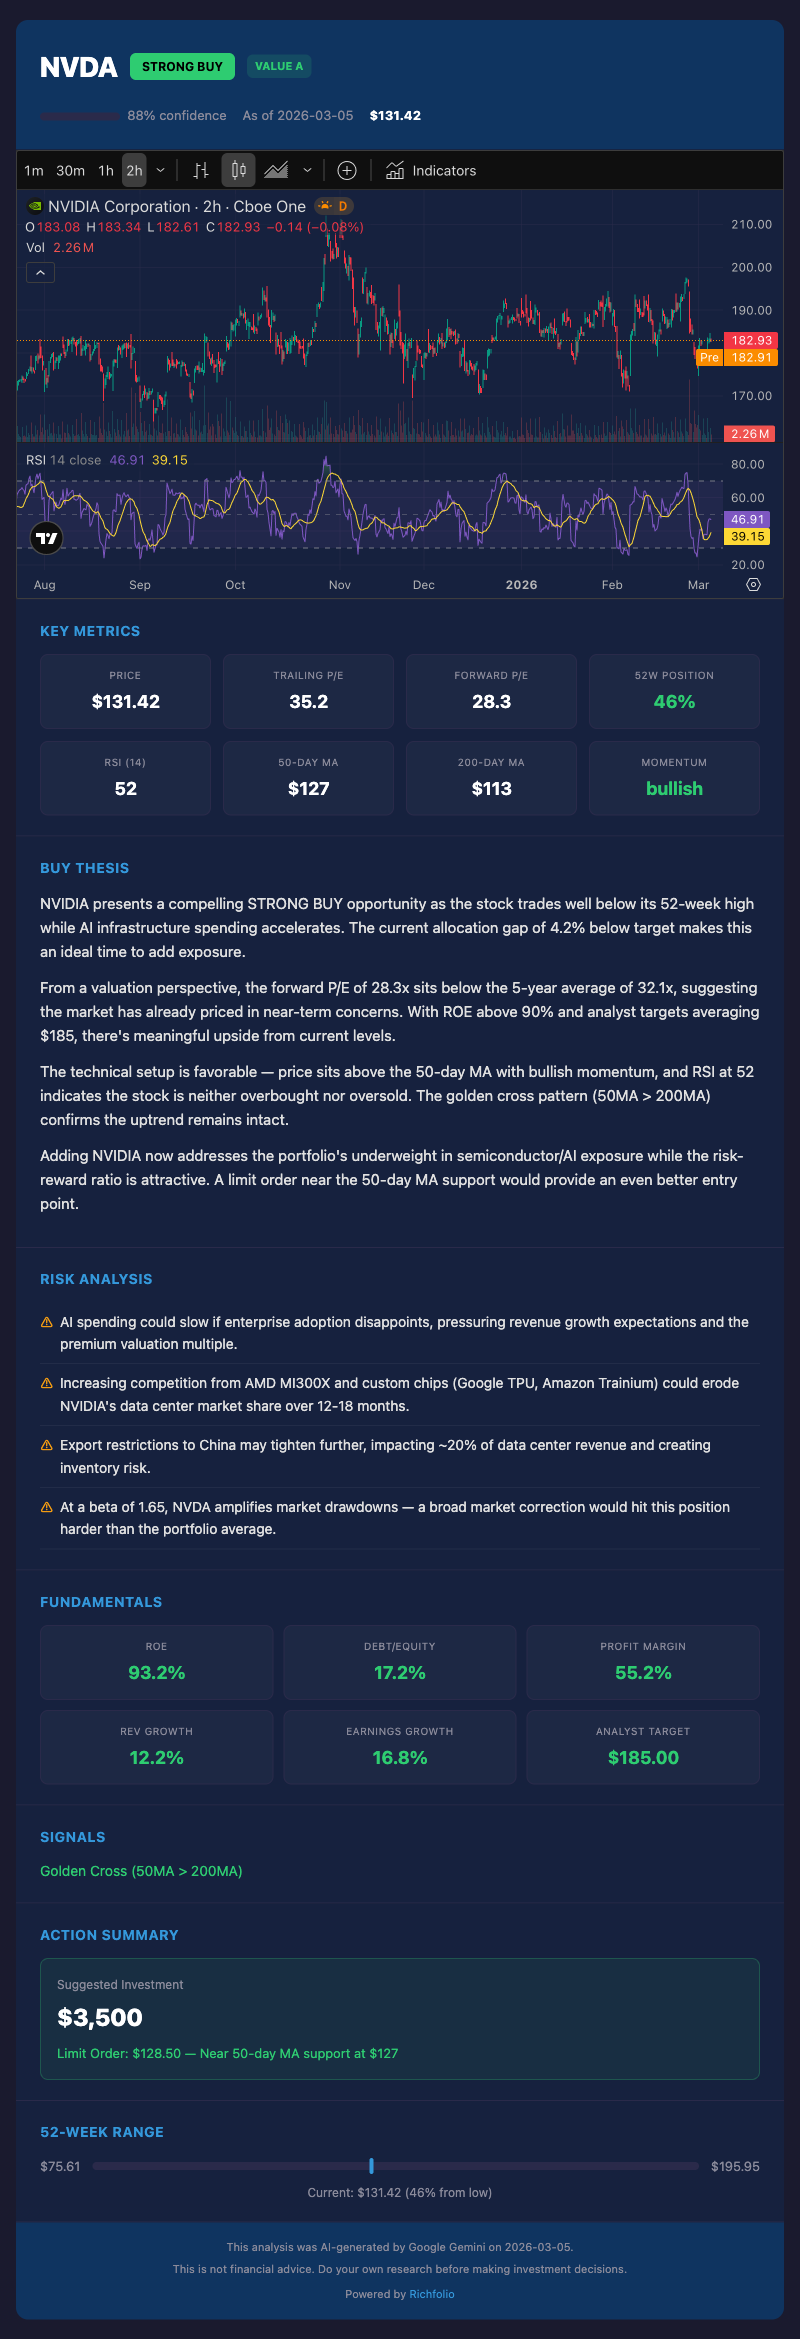
STRONG BUY tickers also get a “More Details” link in the email and Telegram message. Clicking it opens a dedicated analysis page on GitHub Pages with an interactive TradingView chart, detailed buy thesis, risk analysis, key metrics, fundamentals, and action summary — all generated by Gemini 2.5 Flash.
Earnings Calendar Guard
Richfolio automatically detects upcoming earnings dates using Yahoo Finance’s calendarEvents module (zero extra API calls — piggybacks the existing quoteSummary request) and applies programmatic safety caps:
- Earnings ≤ 3 days away → force HOLD — the risk/reward of holding through earnings is too asymmetric for a buy recommendation
- Earnings ≤ 7 days away → cap at BUY — never STRONG BUY with earnings imminent
- Earnings ≤ 14 days away → shown as a colored badge in email and
[earnings Xd]tag in Telegram for awareness
This guard runs both in the AI prompt (soft instruction) and as a programmatic hard cap in the guard pipeline (cannot be overridden by the AI). Inspired by OpenAlice’s earnings calendar awareness for avoiding positions during high-risk events.
Post-AI Guard Validation Pipeline
After the AI returns recommendations, a programmatic validation pipeline runs 6 sequential checks to catch common AI mistakes before they reach the user. Inspired by OpenAlice’s guard pipeline concept with context isolation:
- Bond ETF Cap — short-duration bond ETFs (BSV, SHY, etc.) hard-capped at BUY with 65% max confidence
- Earnings Proximity — enforces the earnings calendar guard programmatically
- STRONG BUY Criteria Enforcement — verifies allocation gap ≥ 2%, confidence ≥ 80%, and at least 1 price-level signal present; downgrades to BUY if any fails
- Max 2 STRONG BUY — sorts by confidence, keeps only top 2, downgrades the rest
- Confidence Sanity — caps at 95% (AI occasionally outputs 98-100); caps HOLD/WAIT at 70%
- Buy Value Sanity — caps suggested buy at the gap amount; zeroes out buy values for HOLD/WAIT
Each guard logs when it triggers for debugging. Guards operate independently — they receive recommendation data, not raw broker/API objects.
Technical Momentum Signals
Richfolio fetches 250 days of historical price data via Yahoo Finance and computes technical indicators for every ticker in your portfolio:
- SMA50 / SMA200 — 50-day and 200-day simple moving averages, with current price position relative to each
- RSI(14) — 14-day Relative Strength Index (below 30 = oversold, above 70 = overbought)
- MACD — Moving Average Convergence Divergence (EMA12 − EMA26, signal line = EMA9 of MACD). Detects momentum shifts via crossovers (bullish/bearish) and histogram direction. Best for trending markets
- Bollinger Bands — SMA(20) ± 2 standard deviations. Tracks %B (position within bands: 0 = at lower, 1 = at upper), bandwidth (volatility), and squeeze detection (bandwidth in bottom 20% of 120-day range signals an imminent breakout). Best for range-bound markets
- ATR(14) — Average True Range with Wilder’s smoothing. Reported as absolute value and % of price. ATR% > 3% = high volatility (AI widens limit orders), ATR% < 1% = low volatility (tighter limits). Useful for position sizing context
- Stochastic Oscillator — %K(14) with %D(3) smoothing. %K < 20 = oversold confirmation (added to momentum signals for STRONG BUY criteria), %K > 80 = overbought. Complements RSI with a different calculation method
- OBV (On-Balance Volume) — cumulative on-balance volume with 10-day trend analysis via linear regression. Reports direction only: rising (accumulation), falling (distribution), or flat (neutral). Absolute OBV values are meaningless across tickers — only the trend matters
- Golden / Death Cross — SMA50 crossing above (bullish) or below (bearish) SMA200
- Momentum Signal — classified as bullish, bearish, or neutral based on price vs MAs and RSI
- Recent Lows — 7-day and 30-day lows for identifying nearby support levels
The AI prompt includes explicit conflict resolution rules when MACD and Bollinger Bands disagree: MACD is trusted in trending markets, Bollinger Bands in range-bound markets. When both agree, confidence is boosted. A Bollinger Squeeze with a simultaneous MACD crossover is treated as the strongest entry signal.
All technical data — including volume change (7-day vs 30-day average) — feeds into the AI prompt for better-informed recommendations. For STRONG BUY tickers, momentum details (including MACD crossover/histogram, %B, and squeeze status) are shown directly in the email and Telegram message.
Limit Order Prices
When Gemini recommends STRONG BUY or BUY, it also suggests a limit order price slightly below current market. The suggested price is based on the nearest support level:
- Moving average support — price near the 50-day or 200-day MA
- Recent lows — 7-day or 30-day low as a support floor
- Round numbers — psychological support at round price levels
Limit order prices and their reasoning are displayed for STRONG BUY tickers in the daily email, Telegram message, and intraday alerts.
Value Investing Framework
For individual stocks (not ETFs or crypto), the AI applies a structured value investing framework and assigns an A–D rating based on five fundamental criteria:
- ROE > 15% — strong profitability
- Debt/Equity < 50% — conservative leverage
- FCF/Operating CF > 80% — strong cash conversion
- Positive earnings growth — growing business
- Price below analyst target — market undervaluation
| Rating | Criteria Met | Meaning |
|---|---|---|
| A | 4–5 | Excellent value |
| B | 3 | Good value |
| C | 1–2 | Fair value |
| D | 0 | Overvalued |
The value rating is factored into the AI’s confidence score (A boosts ~10 points, D reduces ~10 points) and displayed as a colored badge in email and Telegram output.
All fundamental data comes from Yahoo Finance’s financialData module, added to the existing quoteSummary call — zero extra API overhead.
Bottom-Fishing Model
For all tickers (stocks, ETFs, and crypto), the AI evaluates four bottom indicators to detect potential accumulation zones:
- RSI < 30 — oversold territory
- Volume contraction > 20% — selling exhaustion (7-day avg vs prior 30-day avg)
- Price below 200-day MA — deep value territory
- Death cross present — may already be priced in (contrarian signal when RSI is very low)
Thresholds differ by asset type to reduce false signals:
- Crypto (BTC, ETH): bottom signal flagged when 2+ indicators are present. STRONG BUY upgrade considered at 3+.
- Stocks and ETFs: bottom signal flagged when 3+ indicators are present (stricter). STRONG BUY upgrade considered when all 4 align.
Bottom signals are displayed in the daily email, intraday alerts, and Telegram messages. Volume change data is computed from existing chart data — no additional API calls.
Allocation Gap Analysis
Compares your current holdings against your target allocation percentages. Each ticker is scored by how far it is from its target, with suggested buy amounts in dollars and shares.
The analysis uses the higher of your actual portfolio value or configured estimate, so gap calculations remain meaningful even when your current holdings are smaller than your target portfolio size.
Watch List (Research Tickers)
The optional watching array in config.json tracks tickers you want scored and surfaced as signals without committing them to a target allocation. Watch tickers go through the same fetch + AI pipeline as portfolio tickers, but bypass allocation-based rules:
- Excluded from allocation percentage maths — your portfolio total stays at 100%
- Allocation-gap rules (gap ≥ 2% for STRONG BUY, gap > 0% required) do not apply
- Don’t count against the max-2 STRONG BUY cap — every qualifying watch STRONG BUY surfaces
suggestedBuyValueis always 0 — you decide position size manually- Rendered in a separate “Watch List” section in email and Telegram (yellow heading, dashed separator)
Because there’s no allocation gap to anchor on, watch STRONG BUYs require stronger signal confluence: ≥1 price-level signal + ≥2 momentum signals + no major red flags + value rating A/B (for stocks). Use the watch list for research candidates you might add to your target portfolio later — “is now a good time to start a position in NVDA?” — without polluting your allocation maths.
See Configuration → Watch List for the schema.
Dynamic P/E Signals
Trailing P/E is compared against a historically-computed average P/E derived from Yahoo Finance’s earnings history data. No manual benchmarks needed — the system fetches quarterly EPS data and computes the average automatically.
Tickers trading below their historical average P/E are flagged as below avg (potential value), while those above are flagged as above avg (potentially overvalued). ETFs and crypto naturally skip this signal since they have no earnings data.
ETF Overlap Detection
When you hold individual stocks that are also top holdings of ETFs in your target portfolio, Richfolio detects the overlap and reduces the ETF’s buy priority accordingly.
Example: If you hold 30 shares of AAPL and VOO contains ~7% AAPL, your direct AAPL exposure partially covers VOO’s allocation gap. The suggested buy amount for VOO is reduced by the overlap value.
This prevents you from inadvertently over-concentrating in stocks you already hold through ETFs.
52-Week Range Signals
Each ticker’s current price is positioned within its 52-week range (0% = at the low, 100% = at the high):
- Near low (below 20%) — potential buying opportunity
- Near high (above 80%) — exercise caution
- Mid-range — neutral
The AI analysis factors this into its recommendations alongside P/E and allocation data.
News Digest with Sentiment Scoring
Top headlines per ticker from NewsAPI, fetched via batched requests to stay within the free tier’s 100 requests/day limit. Headlines from the last 24 hours are matched to tickers using company name mapping.
Gemini scores each relevant headline with:
- Sentiment: bullish, bearish, or neutral
- Impact: high, medium, or low (how much it could move the stock price)
- Overall sentiment: per-ticker aggregate (bullish, bearish, neutral, or mixed)
Sentiment tags are shown in the AI prompt alongside headlines (e.g., "Apple beats estimates" [bullish, high impact]) and feed into overall news sentiment assessment. This replaces the previous binary relevant/irrelevant filter with richer signal extraction — at zero additional API cost (same Gemini call, richer output schema).
Reasoning Persistence
Richfolio saves a snapshot of every AI recommendation after each daily run — action, confidence, price, and reasoning — into a rolling 7-day history file (state/reasoning-history.json). On the next run, the AI receives a “HISTORICAL CONTEXT” section showing how its own conviction evolved:
AAPL: BUY 72% ($185) → BUY 68% ($187) → HOLD 55% ($192) — weakening
SMH: HOLD 45% ($220) → BUY 70% ($210) → STRONG BUY 85% ($205) — strengthening
This enables the AI to identify conviction momentum — if a ticker has been strengthening for 3+ consecutive days, it confirms the trend. If weakening, the AI becomes more cautious. This is inspired by OpenAlice’s brain/memory persistence concept, which tracks cognitive state as auditable commits.
In GitHub Actions, use actions/cache with the state/ directory to persist reasoning history across workflow runs.
Portfolio Health
Two portfolio-wide metrics calculated from your current holdings:
- Weighted Beta — portfolio-level market risk, weighted by position size
- Estimated Annual Dividend Income — projected yearly dividends based on current yields and position sizes
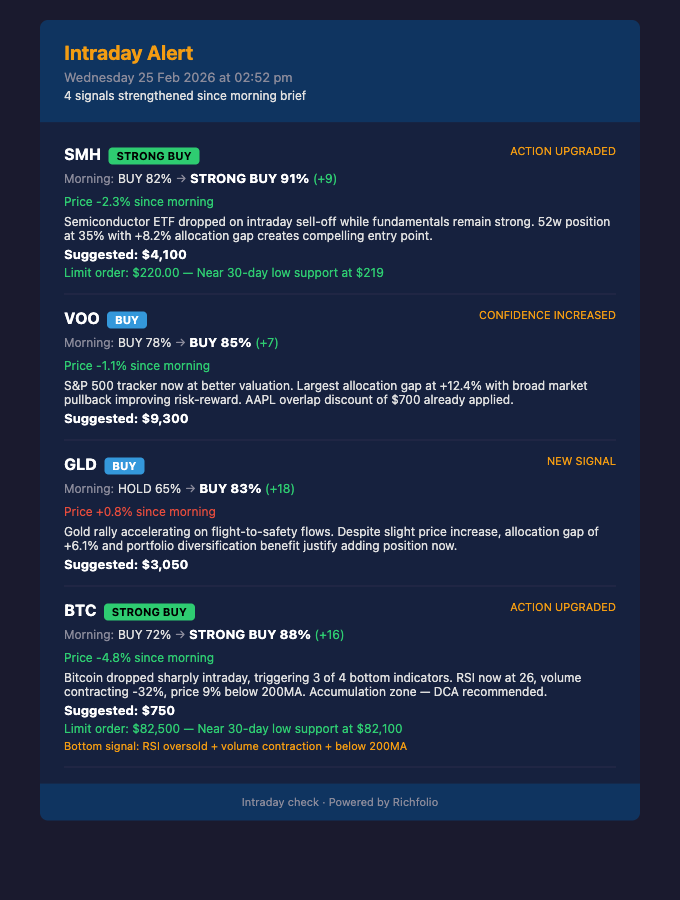
Intraday Alerts
Don’t miss the buying moment of the day. After the morning brief runs, Richfolio saves the AI recommendations as a baseline. Intraday checks (npm run intraday) run every 2 hours during market hours, re-fetch prices and technicals, re-run Gemini analysis (skipping news to save API quota), and compare against the morning baseline.
An alert fires only when:
- Confidence increases by at least 5 percentage points (configurable) AND is above 80% (configurable)
- Action upgrades — e.g., BUY in the morning becomes STRONG BUY in the afternoon
- New signal — a ticker that wasn’t recommended in the morning now has a strong buy signal
Alerts are delivered via email and Telegram with a focused format showing the morning vs current comparison, price change, AI reasoning, and limit order price for STRONG BUY signals. No alert = no message — you only hear from Richfolio when it matters.
All thresholds are configurable via the intradayAlerts section in your CONFIG_JSON variable. See Configuration for details.
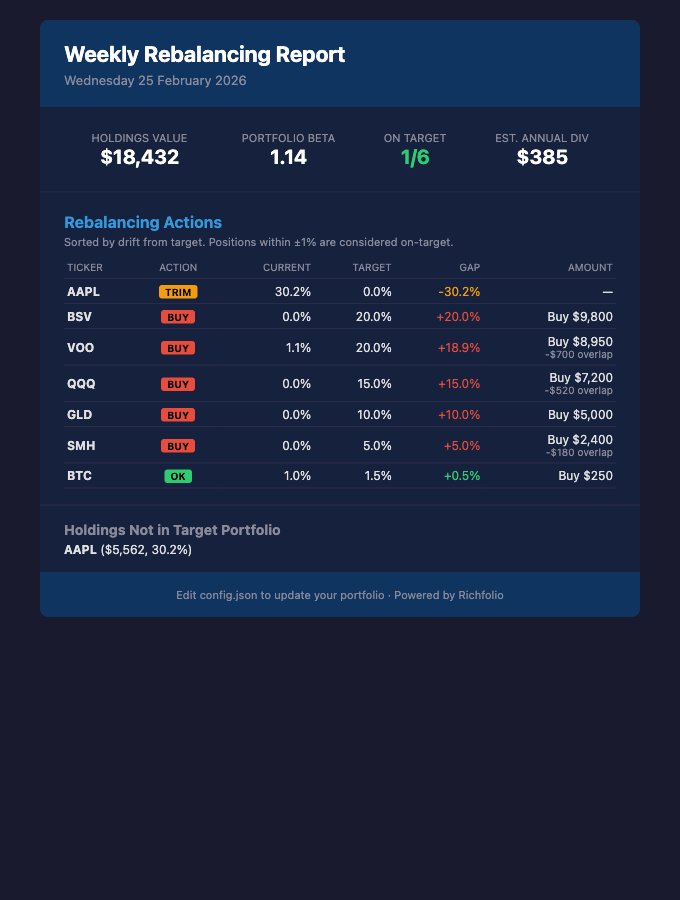
Weekly Rebalancing Report
A separate weekly report (npm run weekly) focused purely on portfolio drift and rebalancing actions. No news, no AI — just a clean table showing:
- BUY — underweight positions (gap > 1%)
- TRIM — overweight positions (gap < -1%)
- OK — positions within target range
Includes overweight warnings and flags holdings that aren’t in your target portfolio.
Dual Delivery
Every report is delivered through two channels:
- Email — dark-themed HTML email via Resend with full detail (allocation table, P/E signals, AI recommendations, technical momentum, limit orders, news)
- Telegram — condensed plain-text summary via Telegram Bot API, optimized for mobile reading (includes technicals and limit prices for STRONG BUY)
Both channels work independently — if one isn’t configured, the other still delivers.
Social Posting (Optional)
Beyond email and Telegram, Richfolio can optionally publish buy signals to public social accounts — X/Twitter, a Facebook Page, a Threads account, and a LinkedIn Page — in daily and intraday modes (never weekly or refresh). Posts are deliberately generic: only STRONG BUY and BUY signals, each showing ticker, action, confidence, and a short reason.
Nothing private is disclosed — allocations, gaps, holdings, and suggested buy amounts are never posted (a sanitizer also strips any such figures from the AI’s reason text), and portfolio and watch-list tickers are merged uniformly as “signals” so ownership is never revealed. The ticker is rendered as a clickable #hashtag on Facebook / Threads / LinkedIn, plus a configurable set of generic hashtags, to boost reach. Every post ends with a “Not financial advice” disclaimer.
Each platform is independently gated on its own credentials and posts inside its own error boundary, so a social failure never affects the email/Telegram briefs. It stays completely off until you add credentials.
See Social Posting for full setup (Facebook, LinkedIn, X) and the config.json toggle.